SiteLens
Turning a fragmented property-inspection platform into a coherent, role-based enterprise product.
At a glance
Project setup, down from 5–6 steps
To key details, down from 4–5
Defect assignment, down from ~3 min
The problem
The product worked, but it had grown one requirement at a time with no operating model underneath. Users faced information overload, deep navigation, duplicated content, weak hierarchy and a structure that ignored who was using it.
What I changed
I ran 1–1.5 weeks of stakeholder sessions and a full product audit (screen inventory, navigation mapping, duplication analysis, role-to-screen mapping) before any visual work. I then rebuilt the product around workflows instead of features, using a simple frame: Role → Responsibility → Information → Decision → Action → Next workflow.
The detail
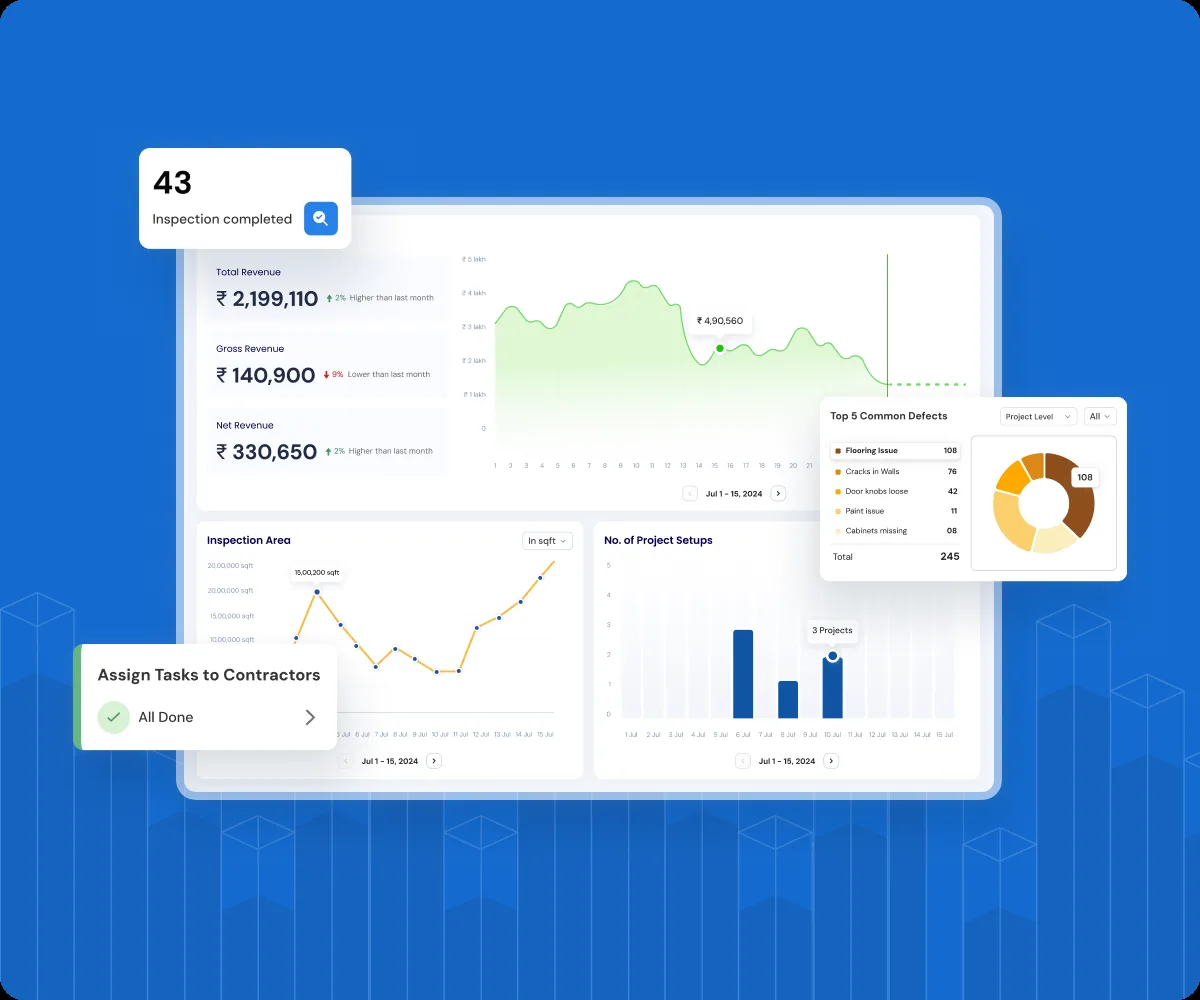
Six role-based experiences (Super Admin, Management, Project Head, Unit Incharge, Internal and External QC Heads) now sit on one shared foundation. Dashboards are decision-first: what is the current state, what needs attention, what to investigate and what to do next. For Project Heads, failed units surface first and detail is revealed progressively.
What I learned. The real problem was missing structure beneath the interface, not the visuals. One shared foundation can support very different decisions from the same data.
What happened
A connected lifecycle from project setup through inspection, defect assignment, rectification, re-inspection and QC validation, built on reusable components for navigation, tables, filters, cards and status patterns. The metrics above are benchmark figures to validate against production data.
Full case study
The complete story
Product overview
Overview of the product
SiteLens 2.0 is a B2B enterprise web application for property inspection, construction quality management and QC operations. It brings project, unit, inspection, defect, contractor and quality information into one operational system.
- What it manages: projects, units and inventory, inspections, defects, contractors, QC teams, quality checks, re-inspection and final status.
- How it works: inspection teams capture quality information and evidence, which then moves through review, assignment, rectification, re-inspection and QC validation.
- Why it was complex: six web roles worked with the same information, but each needed a different view of what mattered, what needed attention and what came next.
Product name and selected details are anonymised for confidentiality.
Business
Understanding the business before designing the product
The client already had a working product that had grown one requirement at a time, without becoming a coherent operating model. I spent about 1–1.5 weeks with stakeholders learning the business, user responsibilities, roles and workflows before starting the audit. The guiding question: how does this business move a property from inspection to a validated final state?
- Operational efficiency: less effort to create, assign, review and manage inspection work.
- Faster defect resolution: shorter time from identifying a defect to validating the fix.
- Project visibility: clearer view of project health, failed units, defects and QC status.
- Quality governance: a clear trail from inspection to remediation, re-inspection and validation.
Discovery
Six web roles. One operational system.
The aim was not six separate experiences. It was to understand how each role worked with the same operational data.
| Role | Focus |
|---|---|
| Super Admin | Setup of teams, projects, inventory, contracts, payments, unit allocation, contractors, QC and reports |
| Management | Project and business performance, quality statistics, defects, teams, contracts and reports |
| Project Head | Project health, failed units, defects, unit allocation, contractor status and QC status |
| Unit Incharge | Unit-level execution, contractor coordination, defects, re-inspection and final status |
| Internal QC Head | QC allocation, inspection validation, rejected defects and issue / no-issue decisions |
| External QC Head | Project selection, external inspection, QC allocation, reporting and quality checks |
Problem
The product had information. It lacked structure.
- Information overload: everything was shown to everyone, with little role-based priority.
- Deep navigation: simple questions like which unit failed, who owns it and whether QC validated it took several clicks.
- Duplication: the same information appeared in several places, blurring the source of truth.
- Weak hierarchy: primary decisions competed with supporting detail.
- Role-blind structure: six roles shared one broad structure despite different responsibilities.
- Fragmented experience: features worked individually but didn't feel like one system.
“I know the information exists, but it takes too much effort to find what matters to my responsibility.”
Audit
Audit before pixels
I deliberately postponed the visual redesign. Restyling an inherited enterprise product would only have polished the fragmentation.
- Screen and feature inventory to separate real capabilities from repeated ones.
- Navigation mapping to find deep paths and information far from the task.
- Duplication analysis to find overlaps and consolidation candidates.
- Role-to-screen mapping to see which roles used which screens, and why.
- Stakeholder walkthroughs to confirm the business intent behind each feature.
- Workflow mapping around responsibilities, decisions, actions and connected workflows.
Insight
Same data. Different decisions.
Six roles could have meant six dashboards, but that would multiply maintenance and inconsistency. Every role used the same entities: projects, units, inspections, defects, contractors and QC status. What differed was the decision each role had to make.
| Role | Their question |
|---|---|
| Management | How is the project performing? |
| Project Head | Which units need attention? |
| Unit Incharge | What work needs to happen next? |
| Internal QC Head | Is this defect valid? |
| External QC Head | Which project and QC work needs attention? |
| Super Admin | Is the system configured and running correctly? |
The data could be shared. The priorities could not.
Strategy
One foundation. Different contexts.
- Shared across roles: navigation, tables, filters, cards, status patterns, detail views, visual language, components and states.
- Adapted per role: information priority and KPIs, primary actions and permissions, content hierarchy, decision context and next actions.
The product was reframed around the operational lifecycle instead of a set of screens, and every dashboard answers four questions: what is happening, what needs my attention, what should I investigate, and what do I do next.
Design decision
Project Head: failed units first
A Project Head needs to know which units need attention. The redesign moved that decision onto the project overview and revealed supporting detail progressively.
Principle: surface the decision first, then provide the detail.
Impact
Less navigation. Faster decisions.
| Metric | Before → After |
|---|---|
| Project creation | 5–6 min → under 3 min |
| Clicks to key details | 4–5 → 2 |
| Defect visibility | 1 click from the relevant context |
| Defect assignment | ~3 min → 1–1.5 min |
| Roles supported | 6, on one product foundation |
| Areas | 12, in one connected project-to-QC workflow |
Benchmark figures for this case study, to be validated against production or usability data.
- North Star: operational workflows completed, from inspection through defect resolution to QC validation.
- Efficiency: time to review, rectify and close a defect; navigation depth; task time.
- Usability: task completion, discoverability, error rate and workflow abandonment.
AI
AI as a design multiplier, not a decision maker
AI sped up synthesis, exploration and documentation. Product judgment stayed grounded in business context, role responsibilities and stakeholder validation.
- Clustering the audit inventory into duplicates, overlaps and consolidation candidates
- Drafting a role × responsibility × information matrix from stakeholder notes
- Exploring alternative navigation structures and workflow models
- Challenging journeys for missing states, extra steps and edge cases
- Exploring clearer status names, labels, empty states and copy
- Speeding up component notes, handoff annotations and UX rationale
Outcome
From information-heavy screens to an operational product
| Before | After |
|---|---|
| Feature-by-feature screens | One structured product architecture |
| Same information for every role | Role-based priorities across six personas |
| Information-heavy dashboards | Decision-first dashboards |
| Repeated patterns | Reusable component foundation |
| Disconnected screens | Connected inspection-to-validation workflow |
Leadership
What I led
- Product strategy: moved the conversation from screens to workflows, responsibilities and decisions.
- Information architecture: rebuilt the structure around a shared data model and role-specific contexts.
- Role-based experience: defined how six personas see, interpret and act on the same data.
- Component strategy: reusable interaction patterns instead of isolated screens per role.
- Design direction: a shared mental model for stakeholders, designers and engineering.
Reflection
The work happened before the pixels
The most important decision wasn't a component or a dashboard. It was recognising that the product needed a clearer model of the business behind it. The answer wasn't six products, but one shared foundation that lets different people make different decisions from the same data.
Have a problem like this?
Tell me what is slowing your team down and I will reply within a day.
Next case study
Scale
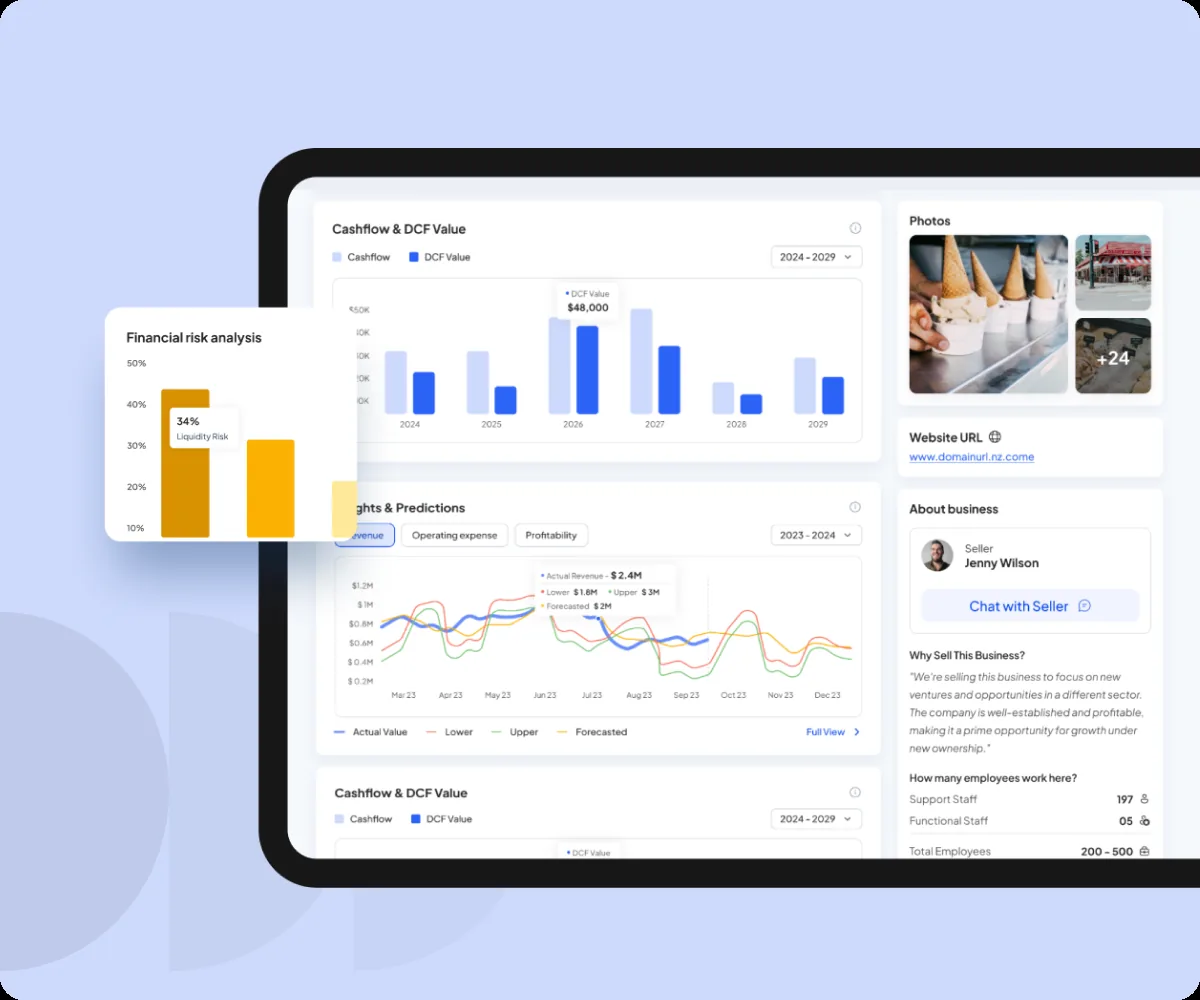
Reframing complex enterprise workflows into a clearer, scalable product experience for buying and selling businesses.